Dashboard
The dashboard is the landing page of the Admin UI and the live view into what the virtual site is doing right now. It is organized into four tabs: Overview, Active Sessions, Nodes, and History.
Overview
The Overview tab shows real time activity for the virtual site.
At the top a row of key metrics presents the current values, each with a small inline spark trend:
- Active sessions: how many sessions are connected right now.
- Upload and Download: current throughput in MiB/s.
- Files in flight: files currently being uploaded or downloaded.
- Rejected: rejected connections.
Below the metrics, an Activity chart plots a single focal trend. A switch above the chart toggles it between Sessions (active sessions and rejected connections) and Throughput (upload and download), so the chart never mixes units.
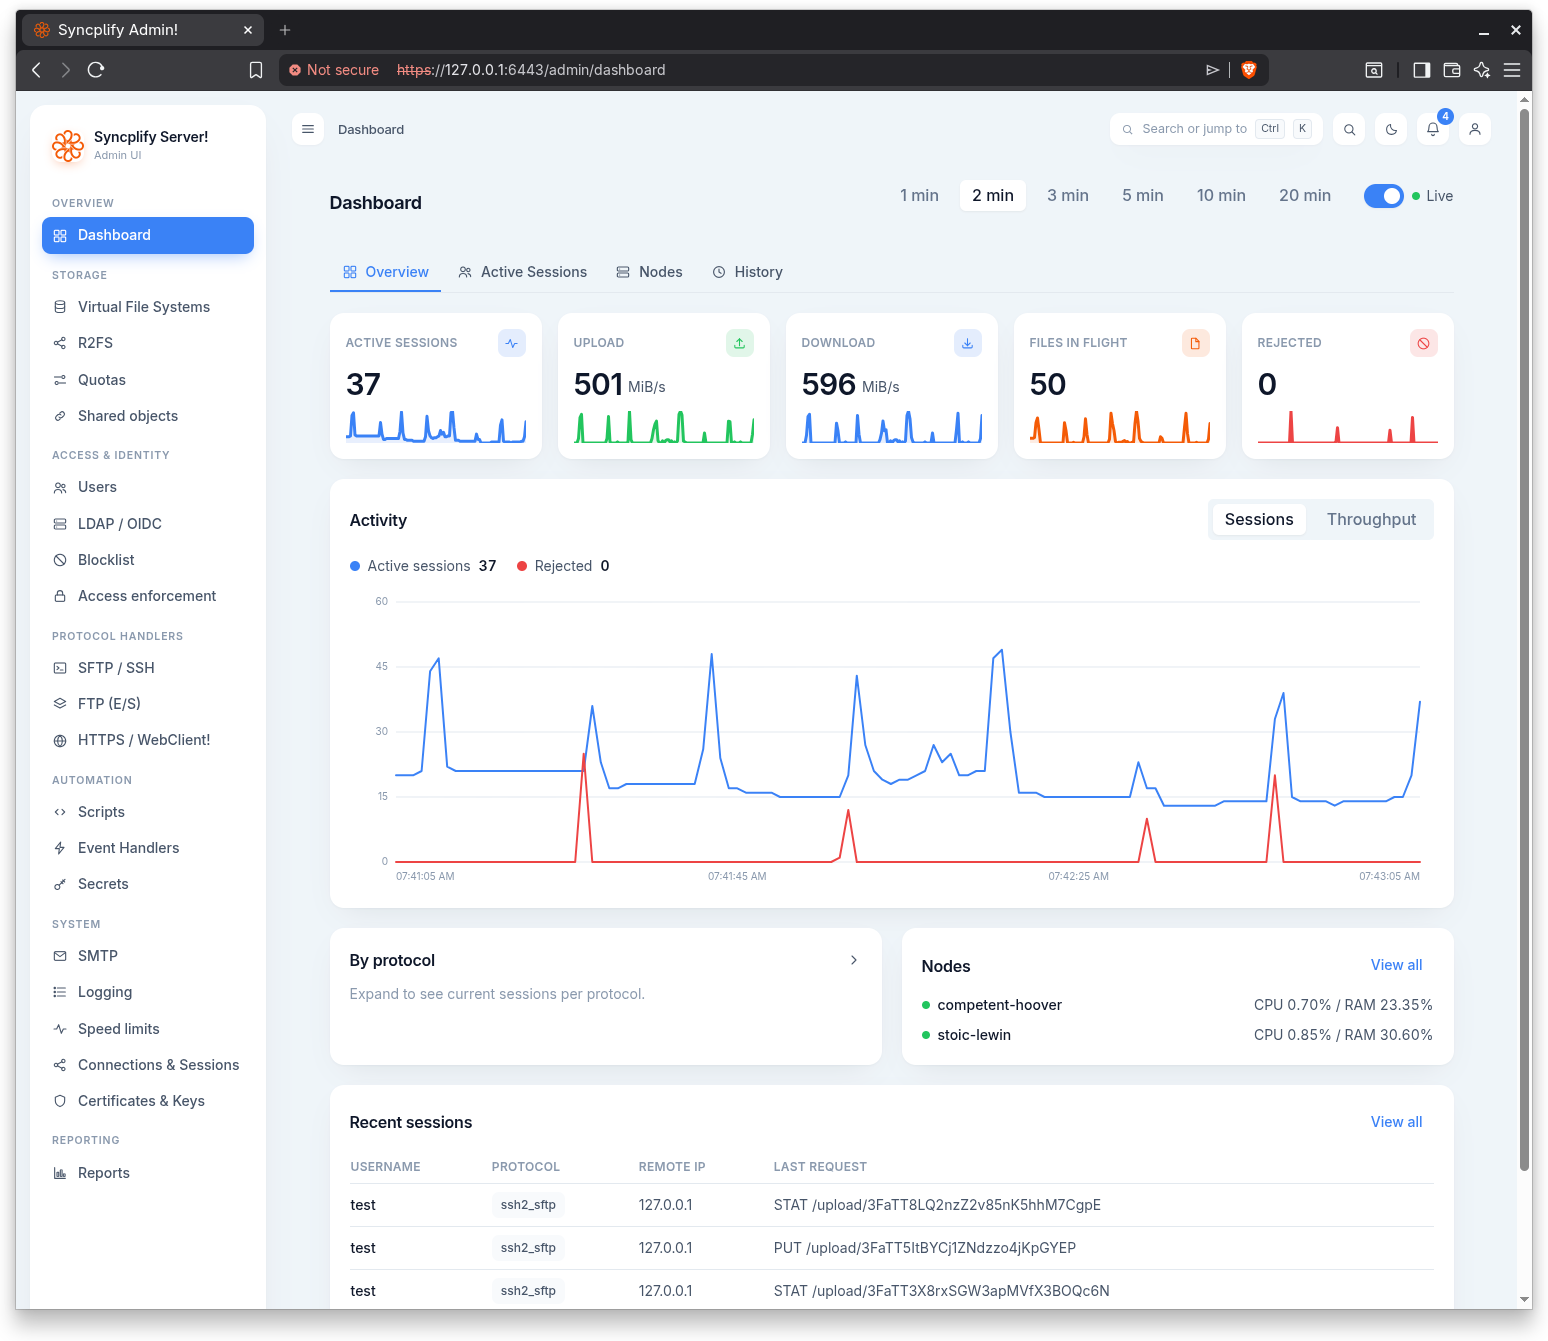
Two panels follow:
- By protocol: an expandable breakdown of current session counts per protocol (SFTP, SCP, SSH/Shell, FTP, FTPS, FTPES, WebClient!, and WebClient! Share), drawn as horizontal bars.
- Nodes: a compact node health summary with each node's identifier, a status dot, a Draining badge where applicable, and current CPU and RAM usage. A View all link opens the Nodes tab.
A Recent sessions table at the bottom lists the most recent sessions with username, protocol, remote IP, and last request. View all opens the Active Sessions tab.
Active Sessions
The Active Sessions tab lists every session currently connected to the virtual site.
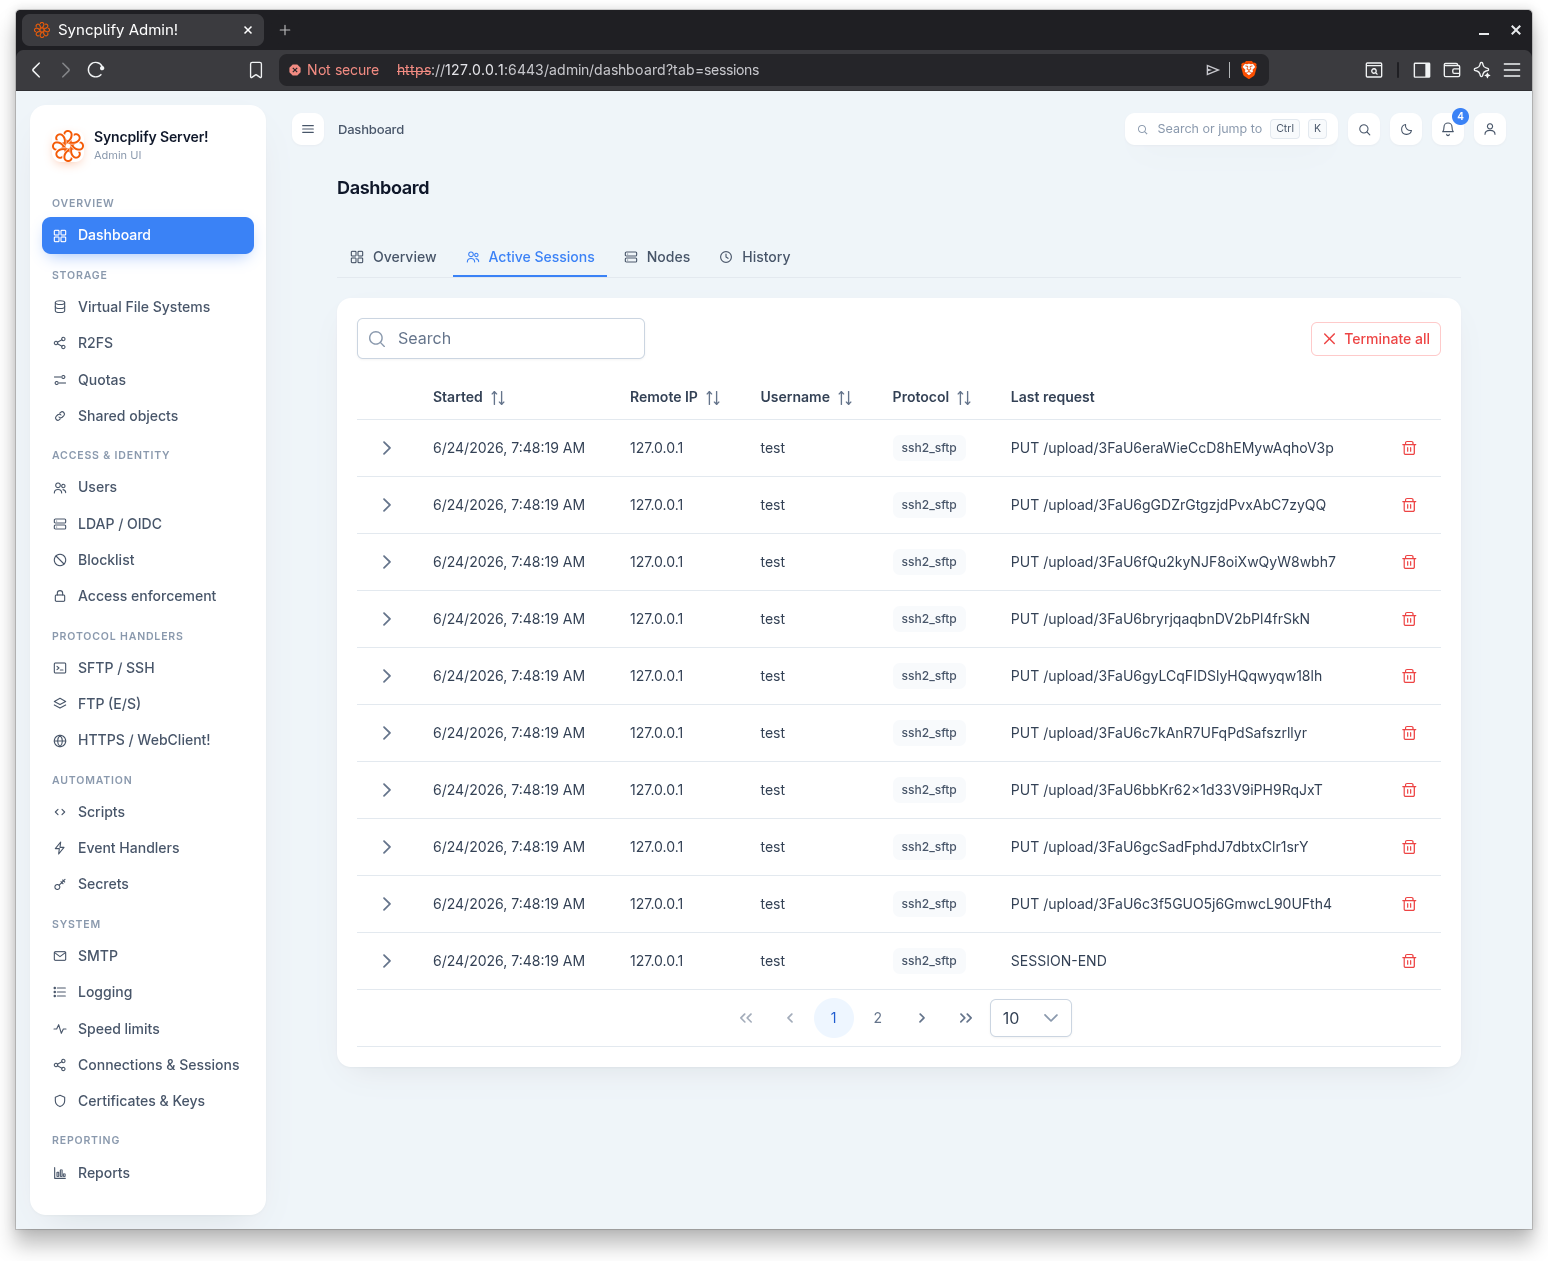
Each session shows details such as the user, protocol, client, node, remote address, when it started, the last request time, and the last error if any.
You can act on sessions:
- Terminate ends a single session. You are asked to confirm.
- Terminate all ends every active session on the virtual site. You are asked to confirm.
Nodes
The Nodes tab shows one card per node, refreshed continuously.
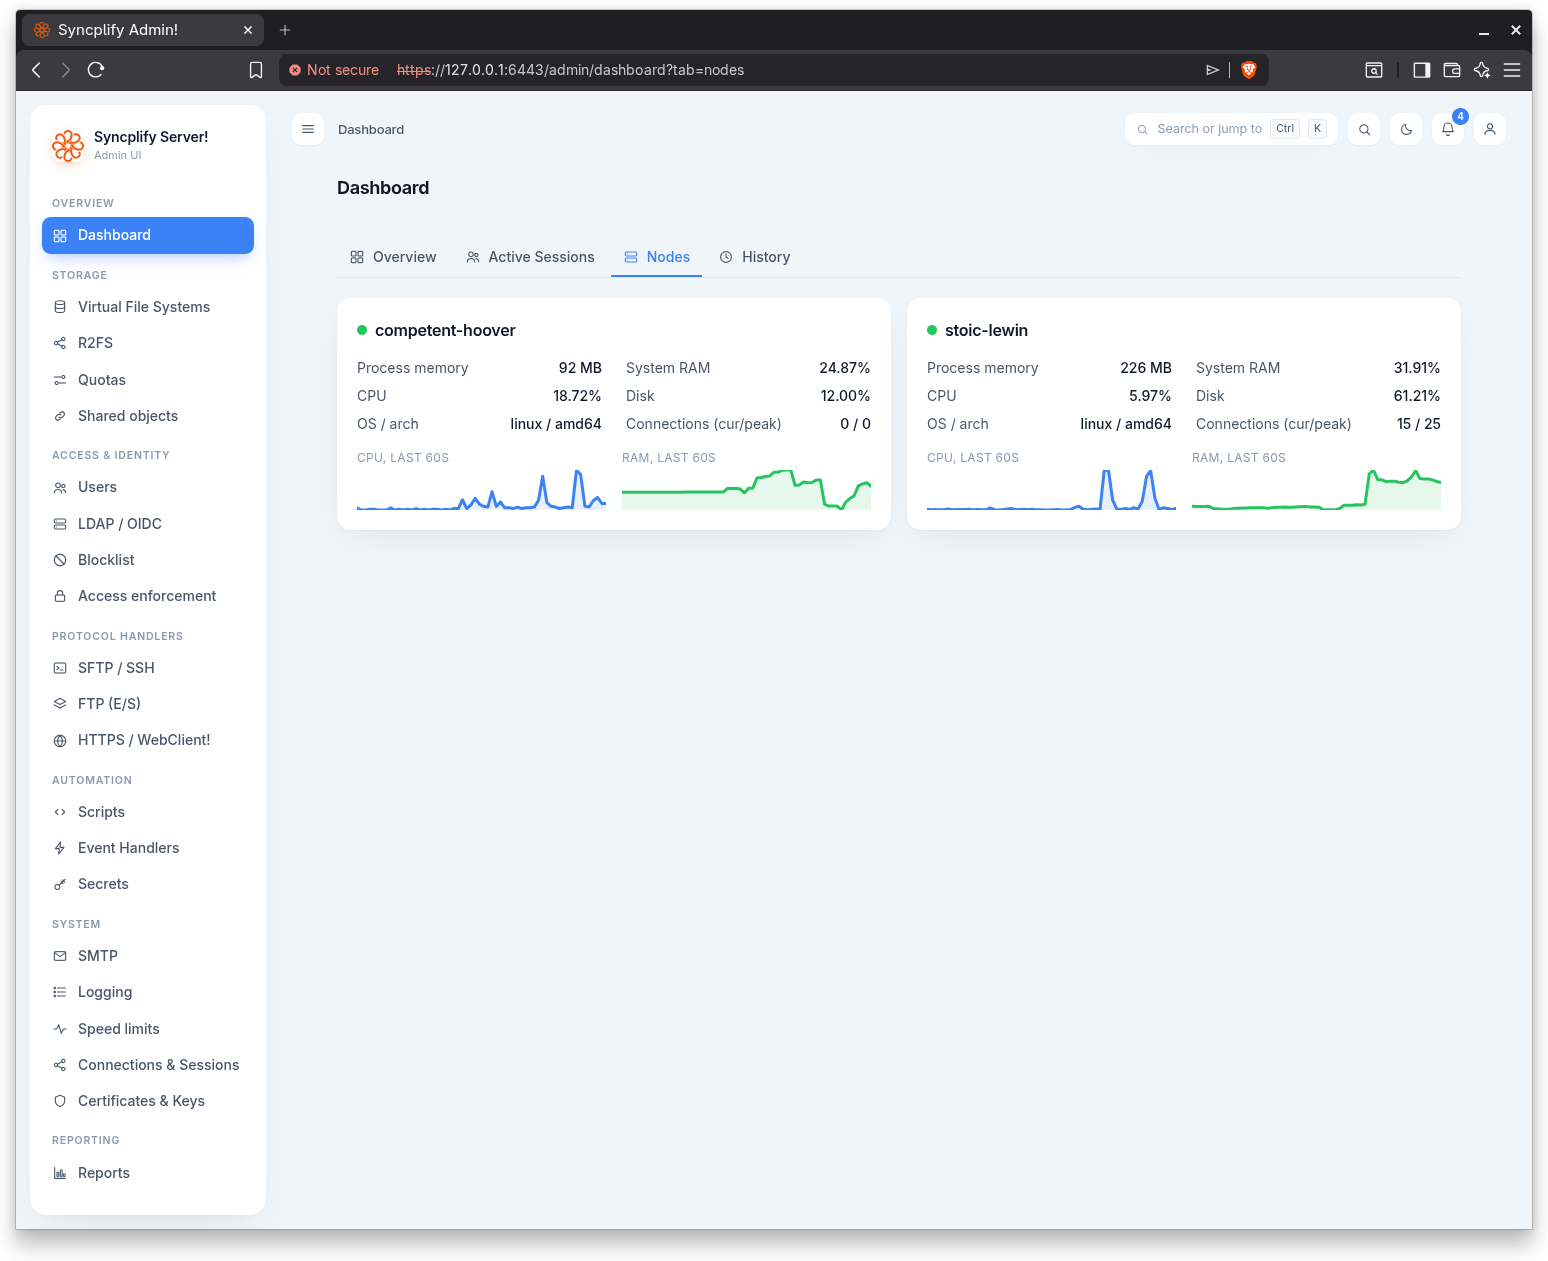
Each card carries the node identifier, a status dot, and a Draining badge when the node is draining. The card reports:
- Process memory and System RAM.
- CPU and Disk usage.
- OS / arch: the operating system and architecture.
- Connections (cur/peak): current and peak connection counts.
Two sparklines show CPU, last 60s and RAM, last 60s.
History
The History tab presents accumulated counters rather than live activity. Figures are shown in two columns: Since last restart and From the beginning, with the date counting started.
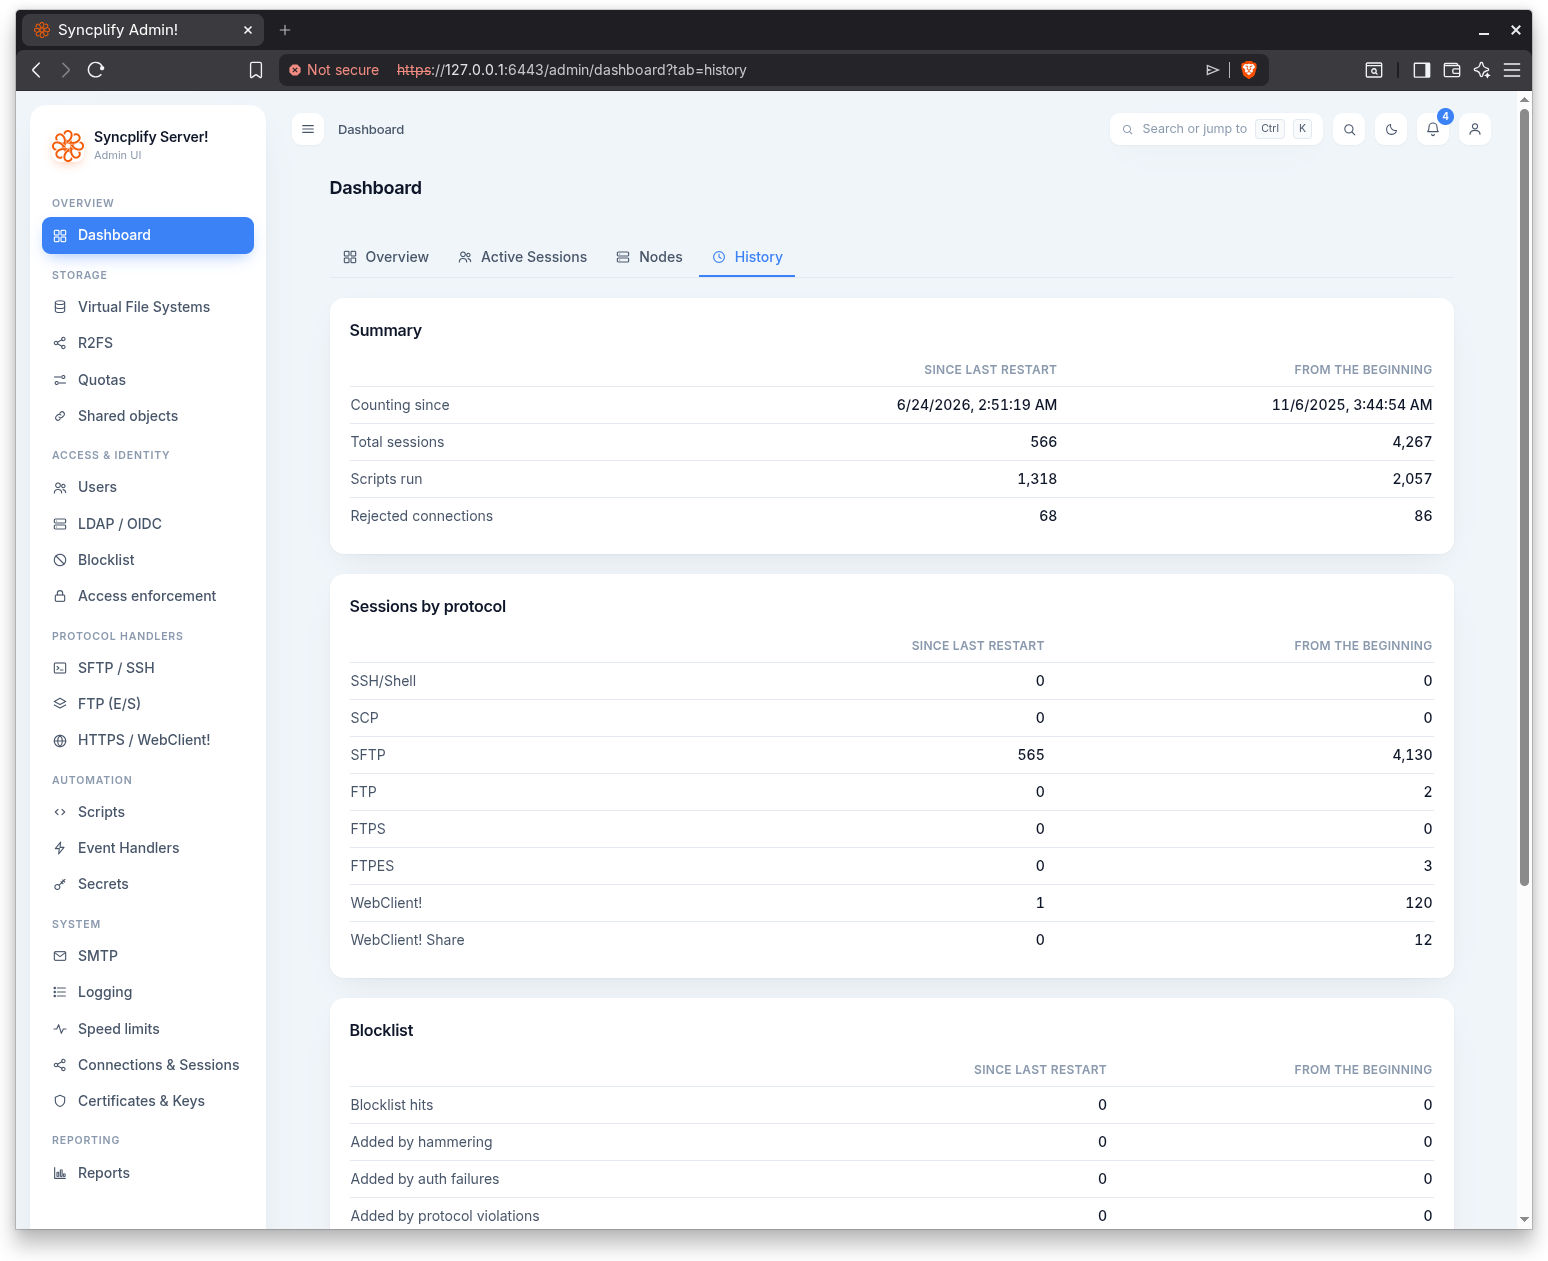
The figures are grouped into:
- Summary: total sessions, scripts run, and rejected connections.
- Sessions by protocol: session counts per protocol.
- Blocklist: total blocklist hits and a breakdown by cause, namely hammering, authentication failures, protocol violations, additions by admin, and additions by script.
- File transfers: files uploaded and downloaded, failed uploads and downloads, and MB uploaded and downloaded.